There are two ways to display the data gathered during a thermography exam. The results can be set to either Line or Bar. This setting can be changed by clicking on the corresponding tab in the upper-right corner.
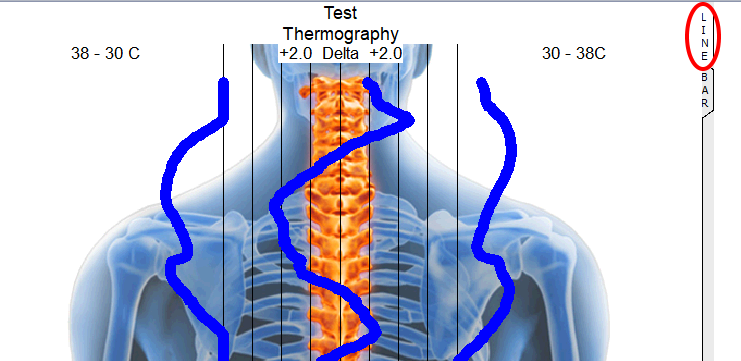
- Line displays the data as blue vertical bars.
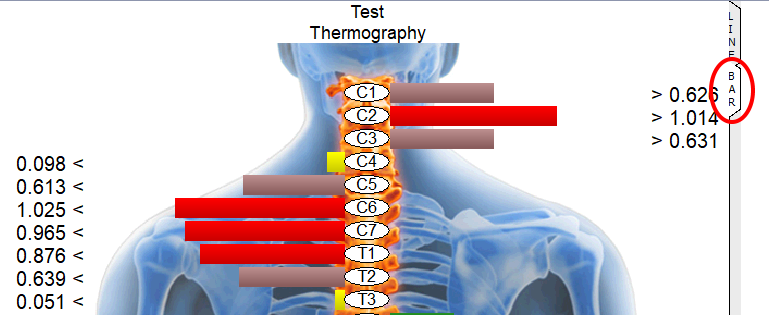
- Bars display the data as series of horizontal bars coming from the site measured.
Click on the buttons inside the tabbed menu for examples of Line and Bar results:
Line
Bar