You can change the scale for DynaROM graphs so that the Y-axis is the same across all graphs. This is especially useful when viewing tests side-by-side.
By default, Autoscale will make the Y-axis max the same as the highest reading from the exam. Changing the scale to a set max makes it easier to compare tests.
Click on the steps inside the tabbed menu:
Step 1: Open Dynamic Settings
Open the Setup menu, select Settings, then click on Dynamic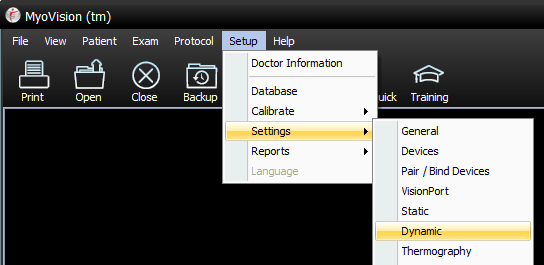
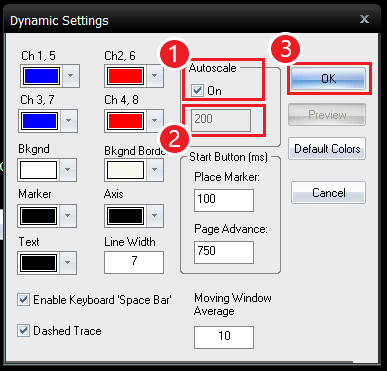
Step 2: Adjust your Settings
- Uncheck the box next to Autoscale
- Set the Scale to the number you want
- Click OK

View the Graph
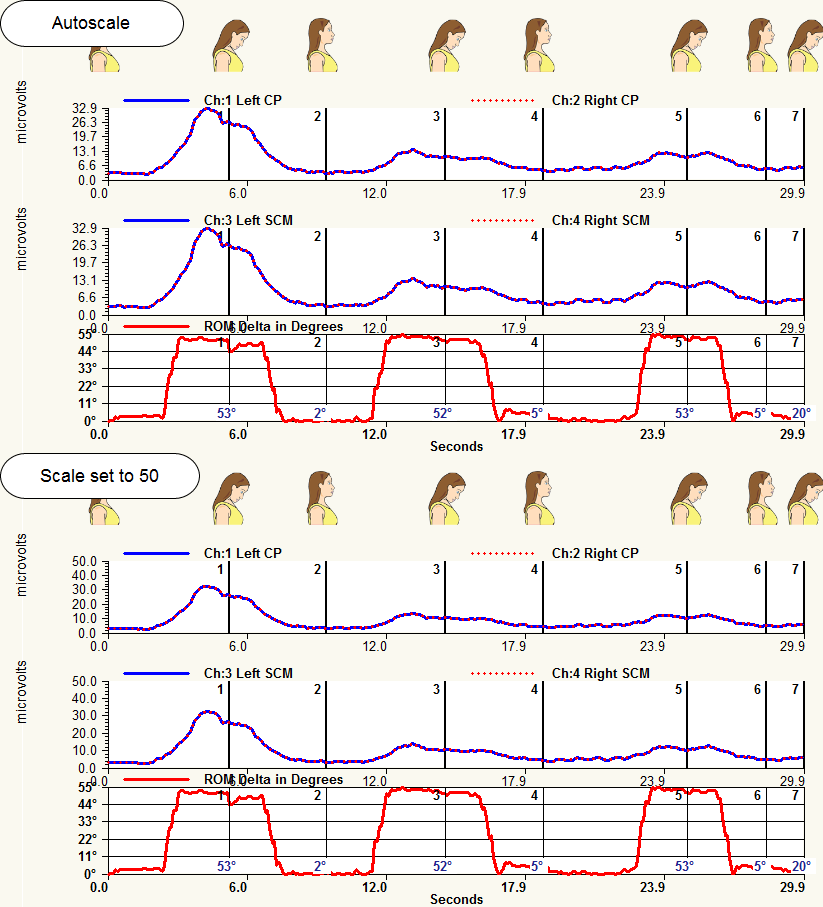
Now open up a Dynamic Exam and look at the change. Below is an example of a graph change from Autoscale to a Scale set at 50.
In the following video our tech support team will show you how easy it is to change the scale of your DynaROM graphs
Setting Suggestions
In general setting the scale to 100 works for most cases. Make sure that the number you use encompasses the highest reading on an exam.
For Cervical tests setting it to 50 might work better since you see lower readings.
It's completely up to personal preference when viewing exams though. Try different settings and find out which works best for you!
Watch the video below for a walk through of adjusting your DynaROM graphs.
If the issue is still not resolved contact our technical support team.
Phone: (800) 969 - 6961 Option 2
Email: support@myovision.com